16 Oct 2026
JUP 4H: Reading a Fragile Trend
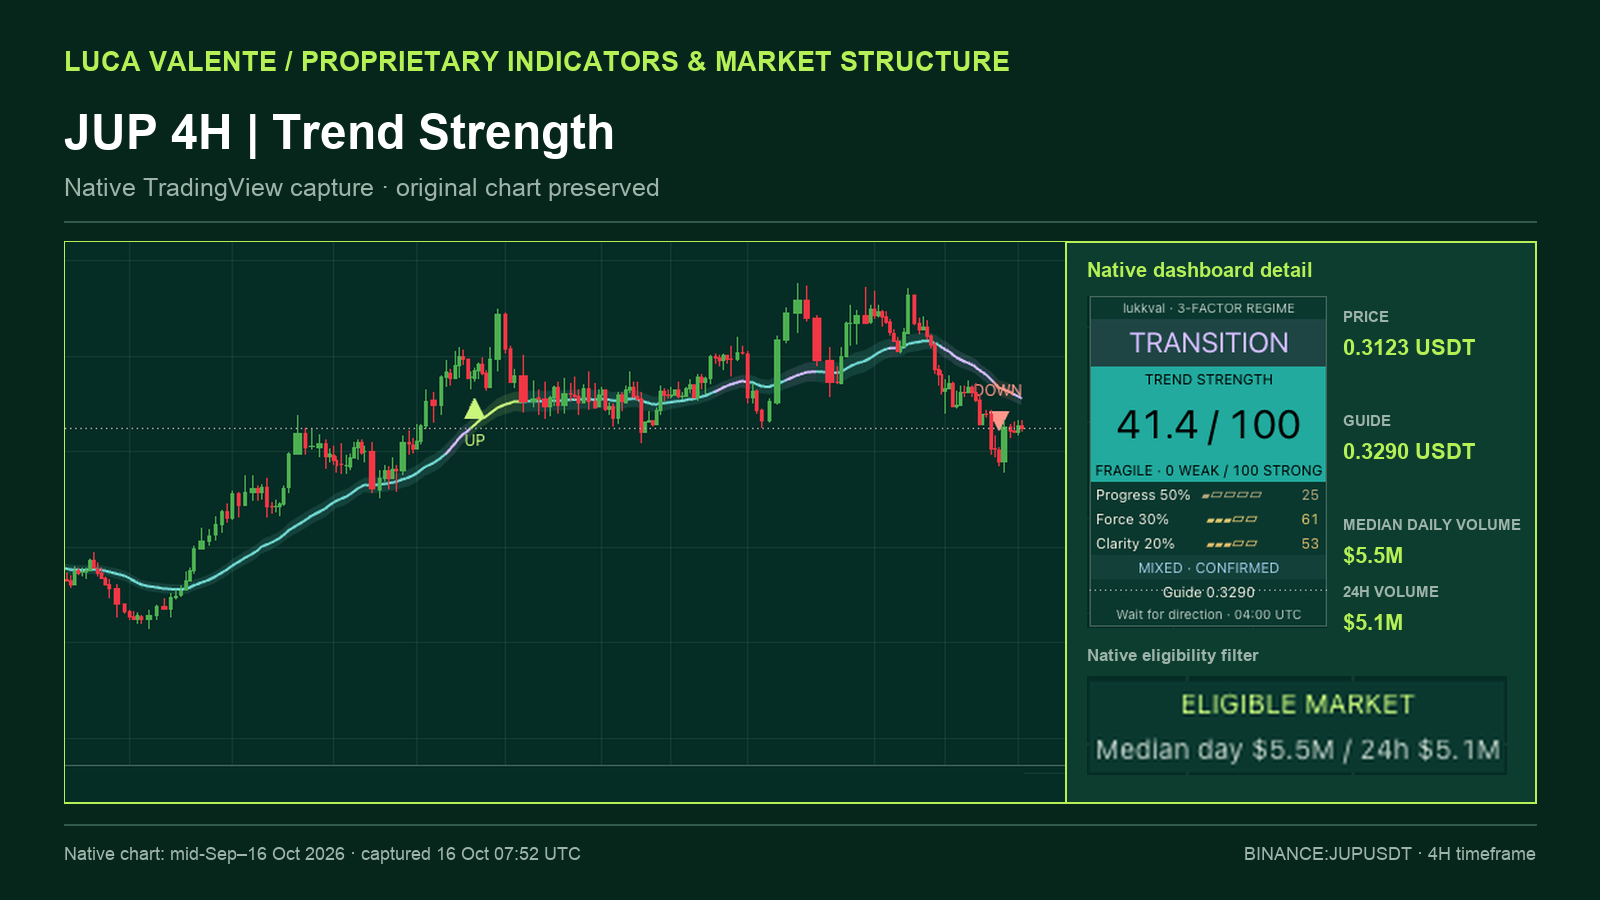
On the 16 October 2026 four-hour chart for Jupiter (BINANCE:JUPUSDT), my proprietary Trend Strength indicator read 41.4 out of 100, placing the market in a Transition regime. JUP was trading at 0.3123 USDT, below the 0.3290 USDT guide. The dashboard described conditions as Fragile / Mixed and advised waiting for directional confirmation.
What the indicator measures
I built this TradingView indicator to make my assessment of trend quality more consistent. It combines three weighted components—Progress, Force and Clarity—into a reading from 0 to 100, with a separate volume-based eligibility filter. The reading describes trend quality; it is not a probability that price will rise or fall.
At capture time, the Binance spot pair passed the activity filter. Median daily volume was $5.5M and 24-hour volume was $5.1M. This screens for activity, not execution depth or transaction costs.
Why the composite was weak
Progress (50% weight): 25. This was the main drag. Price had pulled back from its early-October highs and was below the 0.3290 USDT guide.
Force (30% weight): 61. This was the strongest component, but could not offset the low Progress reading.
Clarity (20% weight): 53. Recent price action showed overlapping swings rather than a clean directional move.
The weighted contribution was 12.5 points from Progress, 18.3 from Force and 10.6 from Clarity. Together, they produce the 41.4 / 100 reading visible in the dashboard.
The reading at capture time
Price was below the guide, but trend quality remained too weak to support a directional stance under my framework. The dashboard’s instruction was to wait for confirmation, rather than infer a trade from a single composite reading.
Capture and limits
The native TradingView chart was captured on 16 October 2026 at 07:52 UTC, before the 08:00 UTC four-hour candle close. Values could have changed before that close; closing values were not separately checked. The indicator describes historical price and volume structure and does not predict future prices.
Sources: Native TradingView chart, BINANCE:JUPUSDT, four-hour interval; captured 16 October 2026 at 07:52 UTC.