18 Oct 2026
The Liquidity Thermometer: USDT and USDC Supply Falls 0.46% as US Macro Signals Diverge
Combined USDT and USDC supply fell by $1.191B, or 0.46%, in the seven days to 18 October 2026. The two tokens accounted for 83.66% of the $306.010B in tracked dollar-pegged stablecoins at the end of that period. Their decline is worth examining alongside the latest US macro readings, but the observations do not establish a causal link.
A mixed US macro backdrop
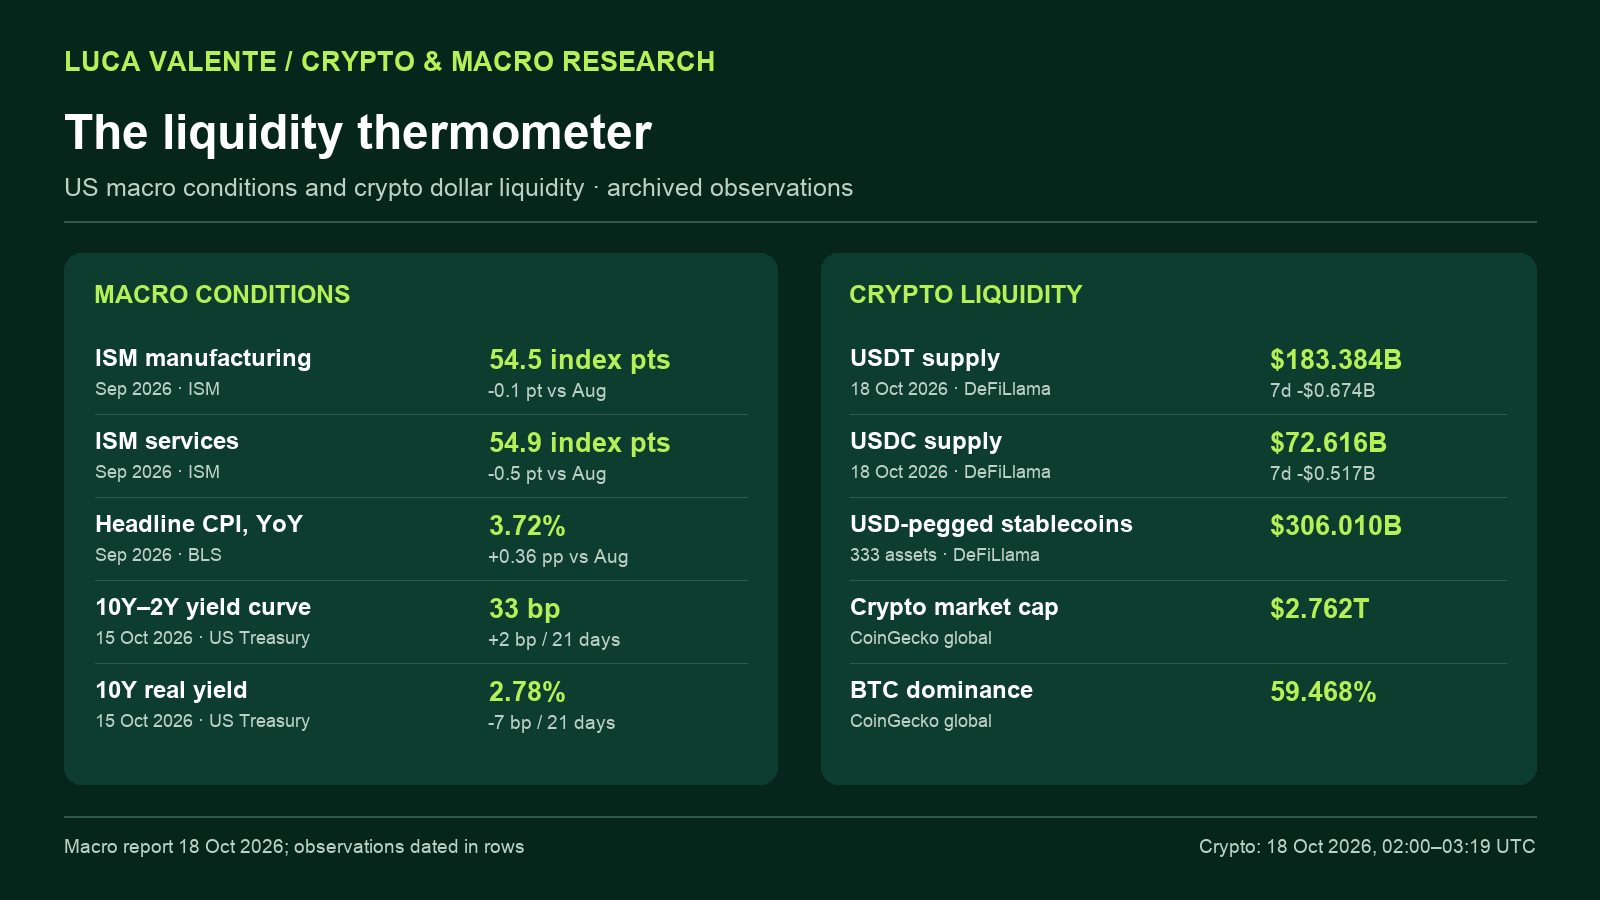
September’s ISM manufacturing and services readings slipped to 54.5 and 54.9, respectively. Both remained above 50, the level conventionally associated with expansion in those surveys. Headline consumer-price inflation reached 3.72% year over year, up 0.36 percentage points from August.
The 10-year real Treasury yield moved in the opposite direction from inflation: it fell 7 basis points over 21 days to 2.78% on 15 October. Higher real yields can weigh on risk appetite; the recent move in this measure was downward. The 10Y–2Y yield curve stood at 33 basis points, up 2 basis points over the same 21-day interval.
The stablecoin move
In the week to 18 October, USDT outstanding supply fell $674M to $183.384B. USDC fell $517M to $72.616B. Together, the two tokens represented $256.000B of the $306.010B tracked in dollar-pegged stablecoins across 333 assets.
The combined seven-day decline raises a question that the two-token comparison cannot answer: did supply elsewhere in the stablecoin market grow enough to offset it? A current total for all tracked dollar-pegged stablecoins is available, but a like-for-like seven-day change for that full universe is needed to answer it.
What to watch next
The useful follow-up is whether the decline persists and broadens beyond USDT and USDC. A single week in the two largest stablecoins is too little to establish a market-wide liquidity squeeze. Outstanding token supply also differs from trading liquidity, exchange depth and gross dollar flows.
Data and timing
ISM and CPI refer to September 2026; the Treasury readings are dated 15 October 2026; stablecoin supply and seven-day changes are from the 18 October 2026 archive. The stablecoin panel also shows crypto market capitalization of $2.762T and BTC dominance of 59.468% from CoinGecko’s global snapshot. Sources: ISM, BLS, US Treasury, DeFiLlama, and CoinGecko.
Sources: ISM, BLS, US Treasury, DeFiLlama and CoinGecko; observations through 18 October 2026.