Training note, written on 25 September 2026 from data as of 19 September 2026. Not part of the published series.
Optimism Trails Other Chains on Transactions and Code, Not on Price
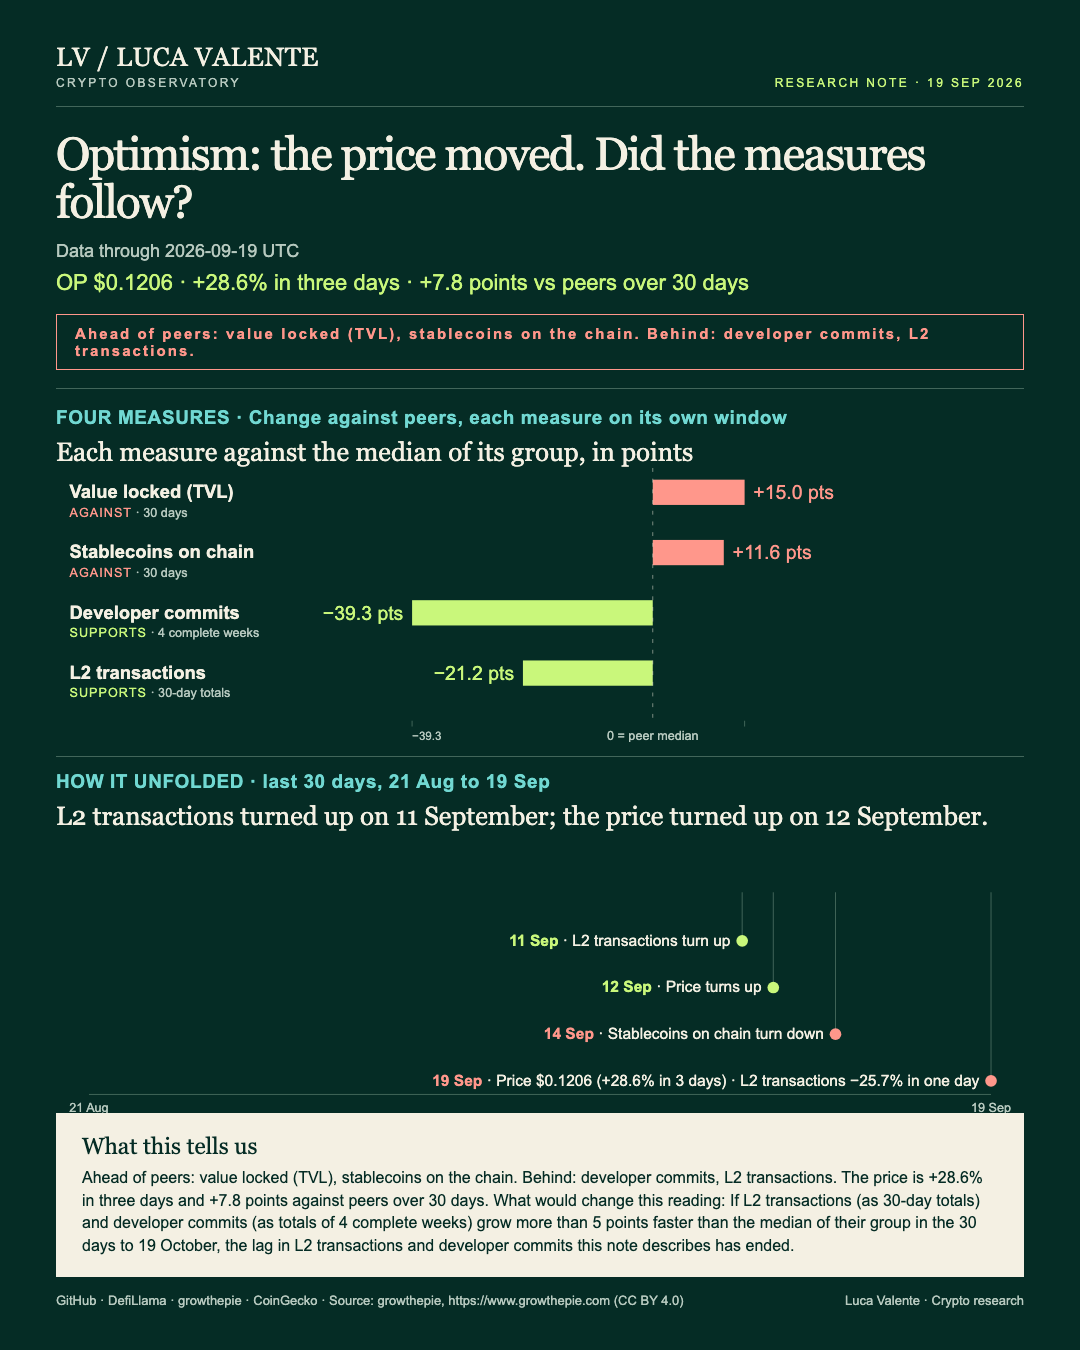
OP had a slightly better month than the typical chain token, while transactions and code work on Optimism lagged that same group. For anyone who holds OP or weighs it against the other networks built on Ethereum, most of the token's gain this month came along with its peers, while the drop in transactions set Optimism apart from them.
Optimism is a second-layer network that runs on top of Ethereum and has its own token, OP. In the month to 19 September the token gained 34.1%, including a jump of 19.4% on the last day alone, against a median of 26.3% for the chains in its group that have a listed price. Net of that median, OP ends the month 7.8 points ahead. Most of the token's gain over the month was matched by the group.
Transactions on the network tell a different story, and the group does not share it. Over the month Optimism carried 1.6% fewer transactions than in the month before, while the median of the 8 chains that report them grew 19.7%, leaving Optimism 21.2 points behind its peers. Over the same month in which Optimism's count slipped, the median chain in its group added roughly a fifth to its own.
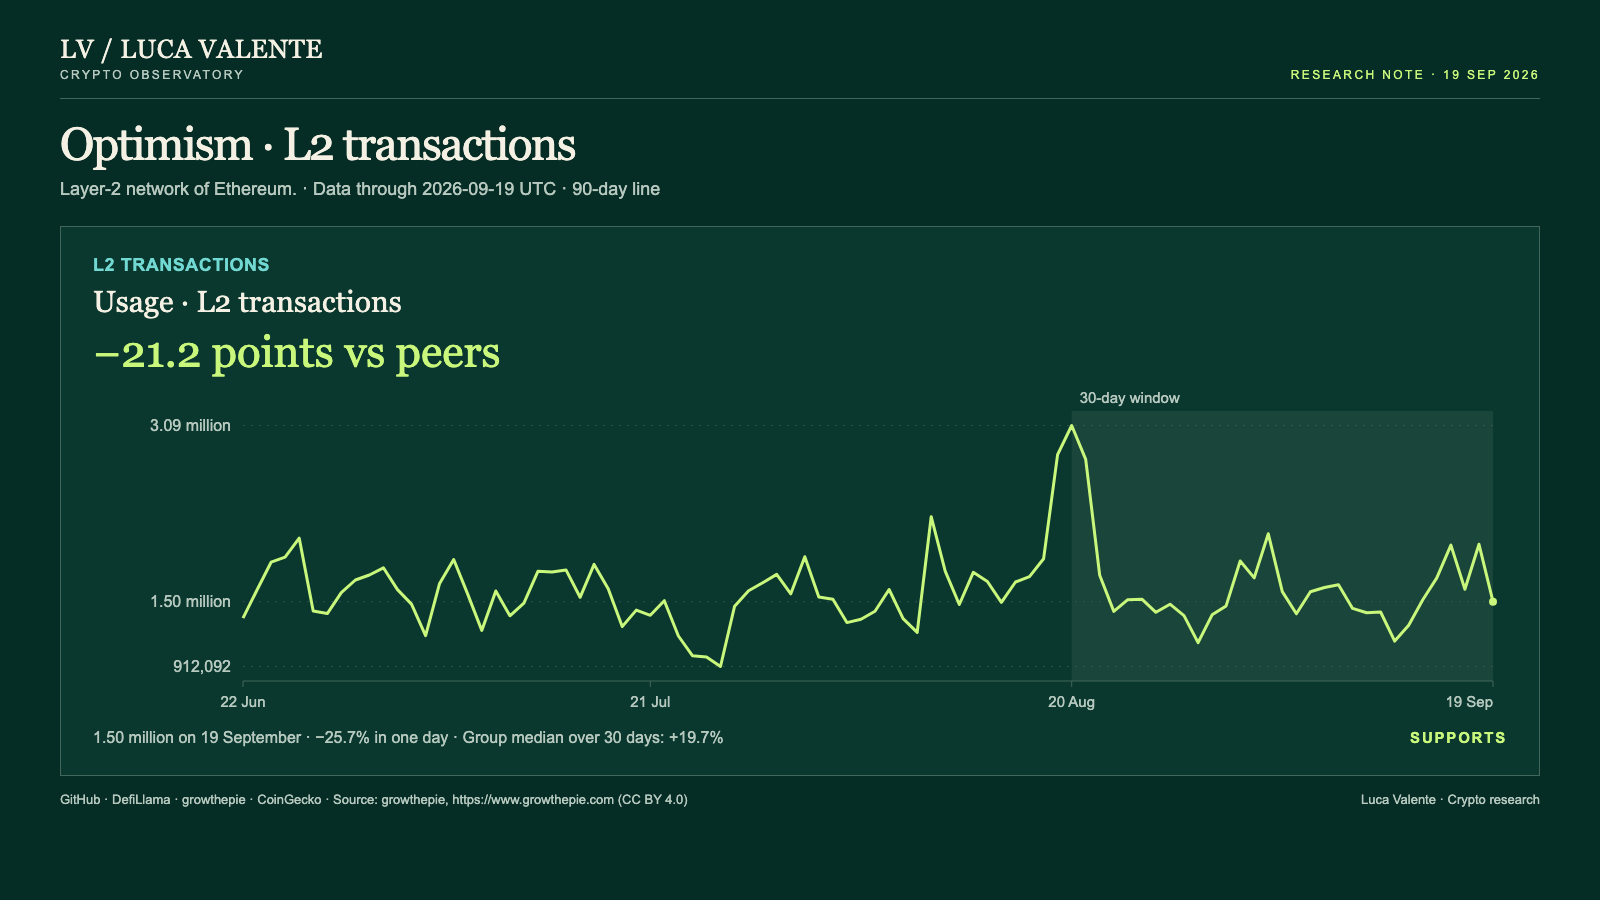
The daily count did turn up on 11 September, a day before the price did. Over the whole month, though, Optimism's total sits below the one before, the opposite of what the median chain recorded.
Code work is the one line where the group also went backwards. Commits to Optimism's public repositories fell 52.6% in a month, and the median chain that reports commits fell too, by 13.3%. Here, for once, part of the decline is shared with the other chains. Optimism's drop, however, runs 39.3 points deeper than the group's, and that distance cannot be put down to the sector.
This reading comes with a date and a test, and both are set against the same peers. If L2 transactions (as 30-day totals) and developer commits (as totals of 4 complete weeks) grow more than 5 points faster than the median of their group in the 30 days to 19 October, the lag in L2 transactions and developer commits this note describes has ended. OP's price has no say in that test, whichever way the token moves over the next month, because the lag in question is one of transactions and code falling behind a rising price.
No revenue split is published for Optimism, and nothing in these figures traces what happens on the chain through to the token itself. Does any of the network's activity reach the people who hold OP?
Two lines argue against the reading, and both sit on the capital side of the chain. Stablecoins held on Optimism grew faster than on the median chain over the month, leaving Optimism 11.6 points ahead of its group on a line that measures the chain itself. On this count the lead is Optimism's own, and it runs in the opposite direction from transactions and commits.
Value locked on Optimism rose 28.6% over the same month, 15.0 points more than the median chain that reports it. The figure is in dollars (part of any dollar change can come from the prices of the assets deposited, and OP itself moved 34.1% over the same days). Even with that caveat, the line counts against the reading.
Put next to transactions, the two capital lines describe a chain holding more dollars than a month ago while carrying fewer transactions than the month before. The latest reading for value locked is the highest of the past 90 days.
Sources: GitHub, DefiLlama, growthepie, CoinGecko.
Source: growthepie, https://www.growthepie.com (CC BY 4.0)
How to read this note
L2 transactions. L2 transactions are transactions recorded on the rollup per day.
Developer commits. Developer commits are code changes recorded in the project's public repositories per week.
Stablecoins on the chain. Stablecoins on the chain is the dollar value of stablecoins held on the chain the protocol runs on.
Value locked. Value locked is the money deposited in the protocol's contracts. It is measured in dollars.
How the changes are calculated. L2 transactions: the last 30 days added up against the 30 days before. Developer commits: the last 4 complete weeks against the 4 before. Value locked, stablecoins and price: end of the window against its start.
Peer group. Chain, 37 entities, Optimism included (who they are). Each median uses the members that report the measure: developer commits 23, stablecoins 31, L2 transactions 8, value locked 30, price 33.
Points. The difference, in percentage points, between a 30-day change and the median of the group.
Value to holders. No revenue split is published for Optimism.
Not in this note. Fees, trading volumes, users and wallets, news or reasons for any move, and anything after 19 September 2026.
Peer group: 37 chains tracked by DefiLlama and growthepie (who they are). 'Net of the group' is the 30-day change minus the group's median.
Not financial advice. This is a research note based on public on-chain data.