Training note, written on 25 September 2026 from data as of 23 June 2026. Not part of the published series.
60.3 Points Ahead On Code At Curve, Close To Its Group On Price
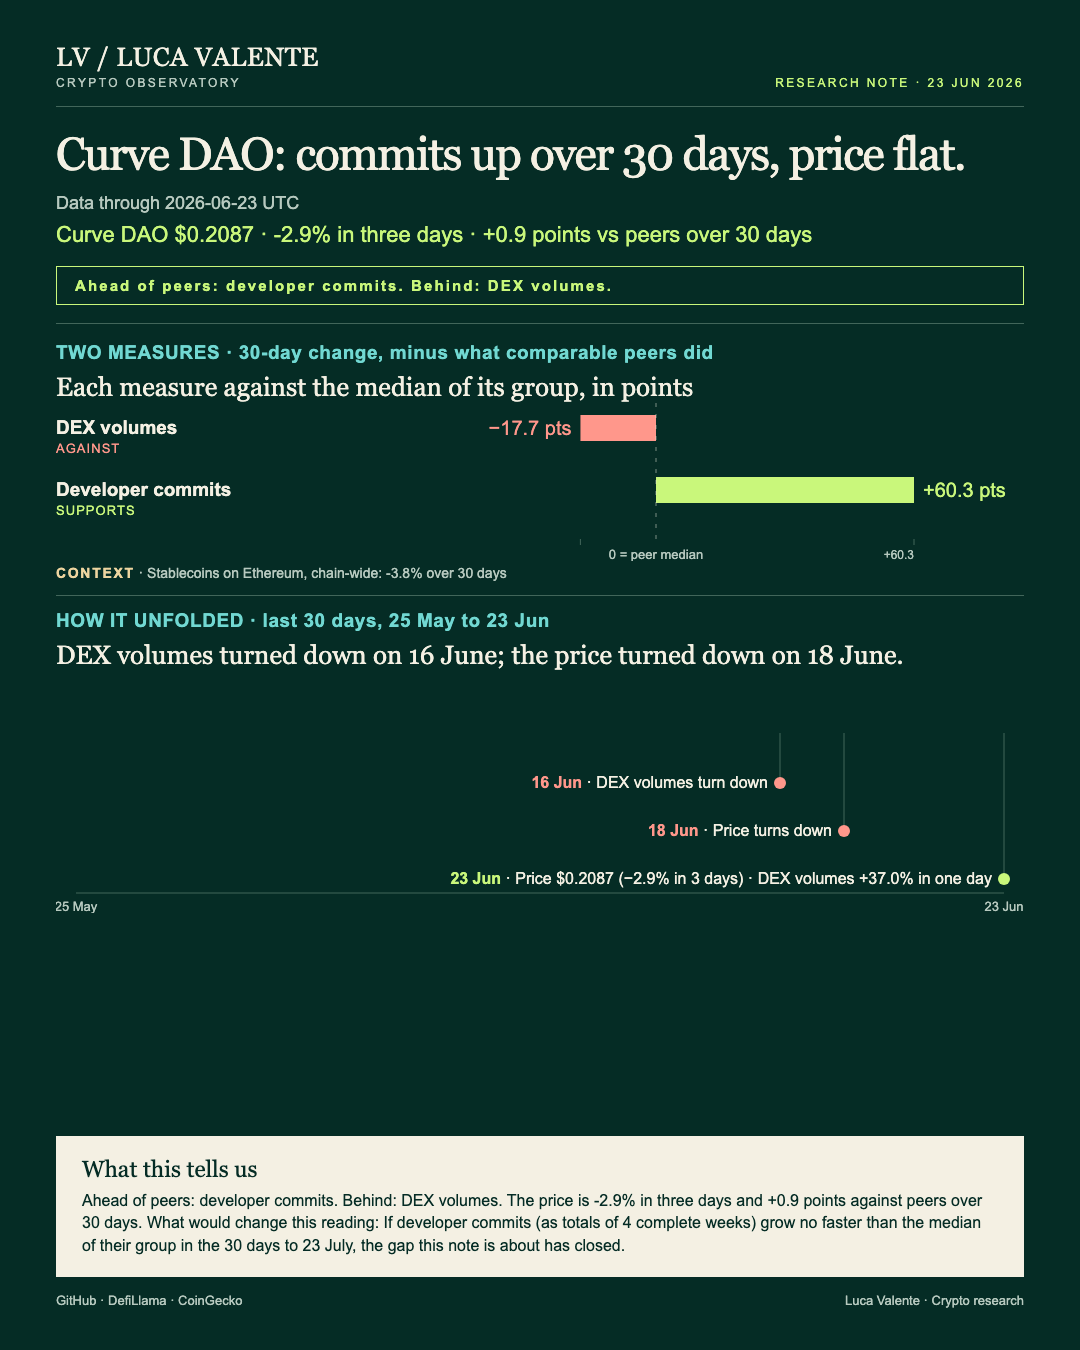
Curve's code changes ran 60.3 points ahead of its peers' over the past month, while its token fell about as far as theirs. Anyone who holds CRV or swaps on Curve sees two signals that disagree. Here is what would make me stop trusting the first.
Think of Curve as a place to swap tokens on Ethereum with no broker in the middle. CRV is its token. The data holds just two measures for Curve itself. The cover draws both as bars against the median of a group of 26 entities, Curve included.
Green is commits, each one a change to Curve's code, recorded in its public repositories and counted by week. That bar stands 60.3 points above the median. Red is trading volume: the value DefiLlama records as swapped through Curve's pools, each trade counted once, deposits and withdrawals left out. It sits 17.7 points below.
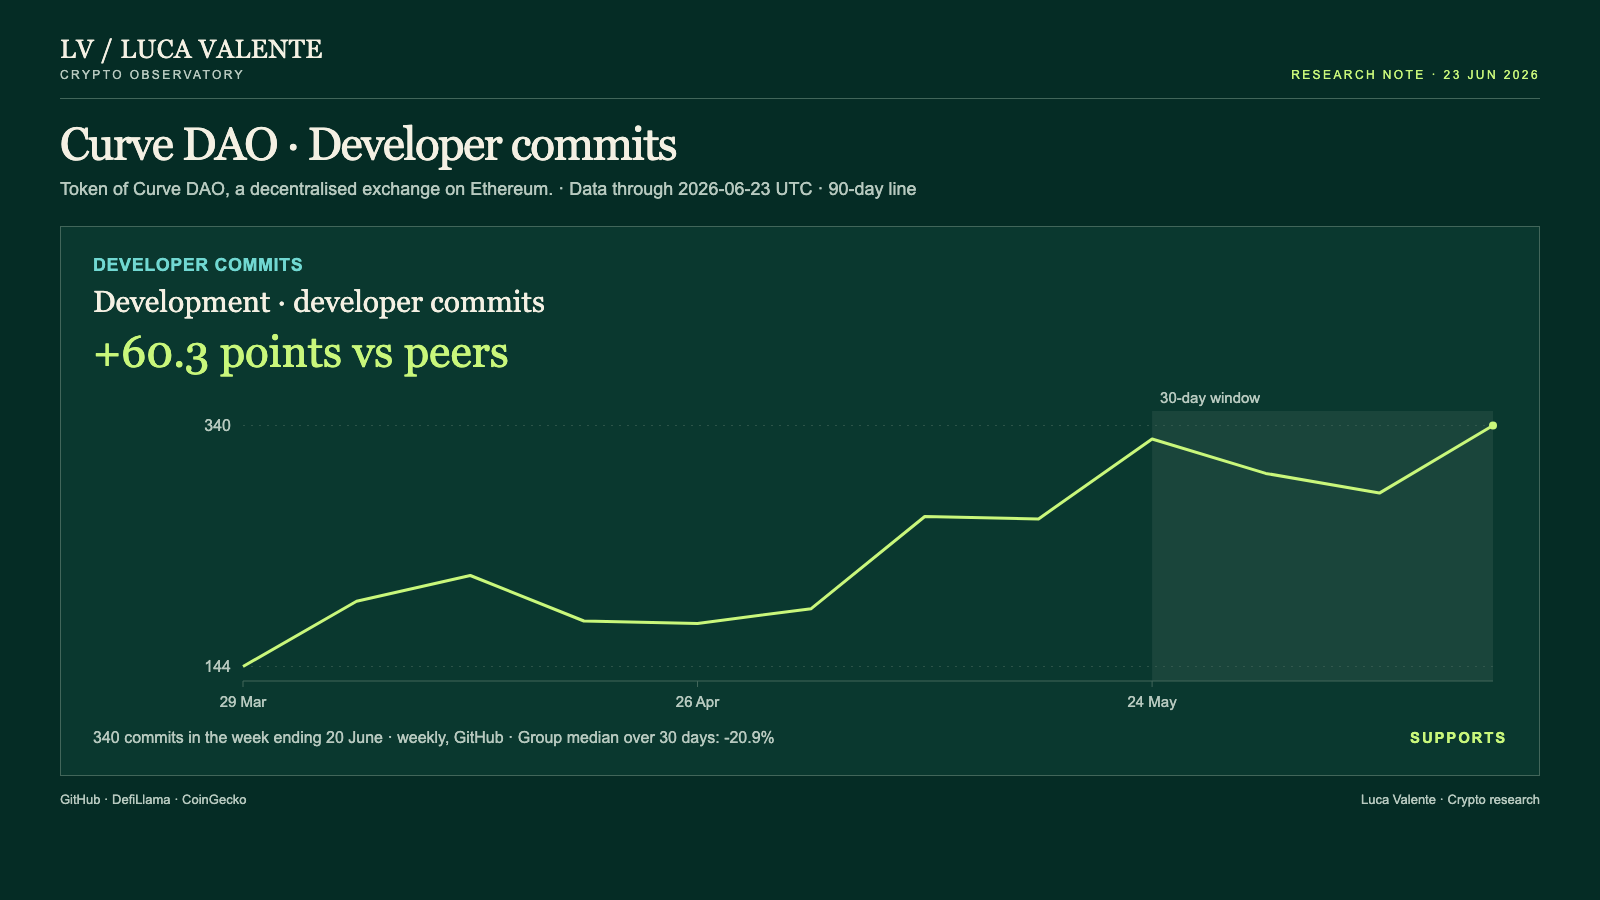
Commits are summed here over four complete weeks. The four to 20 June held 1,255, against 900 in the four to 23 May: up 39.4%. Only 6 of the 26 report commits, Curve included, and their median fell 20.9%. That puts Curve 60.3 points ahead.
Set against its own history, that gap stands high. In the last 90 days, its middle half ran from -0.2 to 38.2 points. Today's reading sits above that band. That says the reading is unusual for this line; it does not say what the code was for.
Week by week, the line is less tidy. Of commits, volume and price, it turned down first, in the week of 17 May. It fell in 2 of the next 4 weeks, yet the four-week total still ended 39.4% higher. The last complete week hit 340 commits, the most in twelve weeks, up from 285 the week before.
CRV closed 23 June at $0.2087, 10.9% below the $0.2342 of 24 May, end of window against start. The median of the 10 group members with a listed price, Curve included, fell 11.8%. CRV sits 0.9 points above it. The price turns down on 18 June and ends 2.9% below its level three days earlier.
That leaves a clear split. Code work pulled away from the group, and the price stayed with it. The question for the month ahead is whether the split closes. Three things could talk me out of it.
Trading volume is the first, and the only measure here against the reading; the cover's timeline shows it turning down on 16 June. Summing the 30 days to 23 June against the 30 to 24 May, it fell from $4.17 billion to $3.72 billion: down 10.8%. The group's median rose 6.9%, leaving Curve 17.7 points behind. Volume is the thing people actually do on an exchange.
At first I read the jump on 23 June as the objection fading: 37.0% in one day, to $110 million. It isn't. The 30 days to 23 June include that day and still add up 10.8% lower.
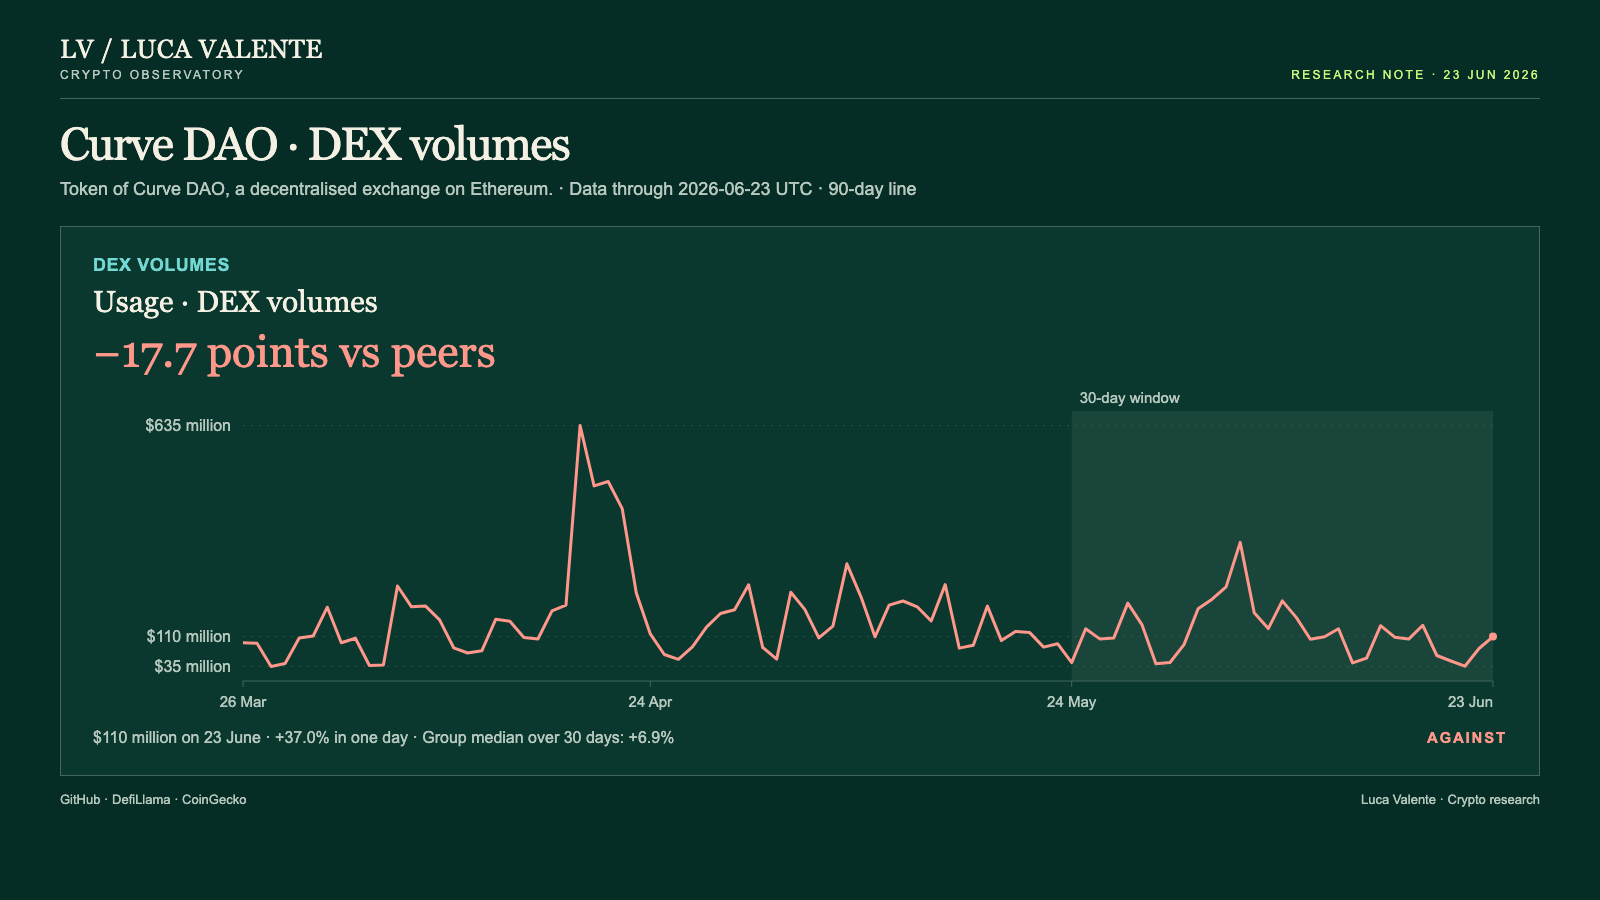
Still, volume leaves the reading standing. Trading, capital and code work are separate families here, read one at a time, and this note is about code against price. What volume does say is that the extra code has no match in trading this month.
What the data leaves out is the second. It has no value locked, no fees and no count of users or wallets for Curve. Capital appears only as stablecoins on all of Ethereum, down 3.8% over 30 days, and that describes the chain, not Curve. Nothing here explains any move, and nothing runs past 23 June.
Above all, I want to know what those 1,255 commits delivered to people trading on Curve. These numbers cannot say. Before calling this more than a busy stretch, I would need a second month like it.
Last comes the commit line. Since volume already disagrees with me, code work carries this note alone. If developer commits (as totals of 4 complete weeks) grow no faster than the median of their group in the 30 days to 23 July, the gap this note is about has closed. Everything rests on code growing faster than its group while the price keeps pace; lose that edge and the gap is gone.
Sources: GitHub (commits), DefiLlama (trading volume, stablecoins on Ethereum), CoinGecko (price).
Peer group: 26 exchanges tracked by DefiLlama (who they are). 'Net of the group' is the 30-day change minus the group's median.
Not financial advice. This is a research note based on public on-chain data.